DevOps and Telemetry: Supporting systems
Note This is part 2 in a series of posts about DevOps and the role of telemetry in it. In part one I described the reasoning behind the series and explained how I started with logging (usage) telemetry for a SaaS application. You can read part 1 in the series here. In this post I want to explain about the next step: logging information about the systems that support the application: servers, database, storage and anything that comes with that.
Series overview
- Part 1 - My journey with telemetry and starting with logging
- Part 2 - Supporting systems and how to gather that information (this post)
- Part 3 - Supporting the support systems
Telemetry on supporting systems:
For a SaaS application running on an Azure Web Service Plan, you can use a lot of components, so I’ll focus on stuff I have used in the past and are most commonly used:
- App Service Plan
- SQL Database
- Blob Storage
This should be enough to give a broad overview of the standard monitoring options.
Available information from Application Insights
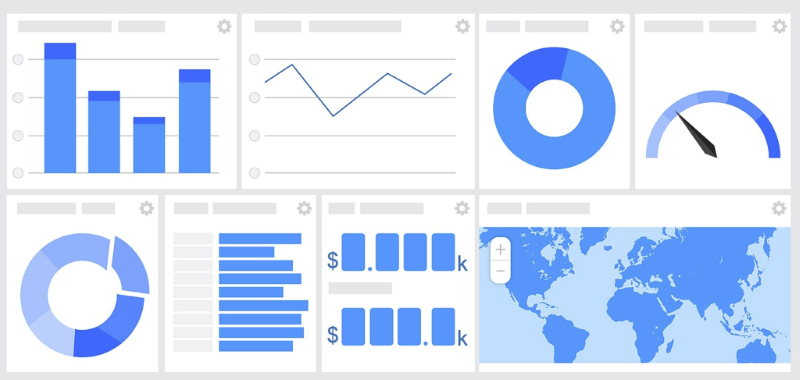
I’ll start at the point from the previous post where I added Application Insights to the application: I had (request) telemetry available from that, with visibility into all calls to depending services. From this, I started creating a dashboard to bring all this information together in one view, so that it could be shared with the team responsible for building and running the application. From Application Insights, I always add the application map to the main telemetry dashboard for the operations team. In that map, you’ll get a quick insight into ALL aspects of the application, including the parts that are suffering (performance wise).

App Service Plan
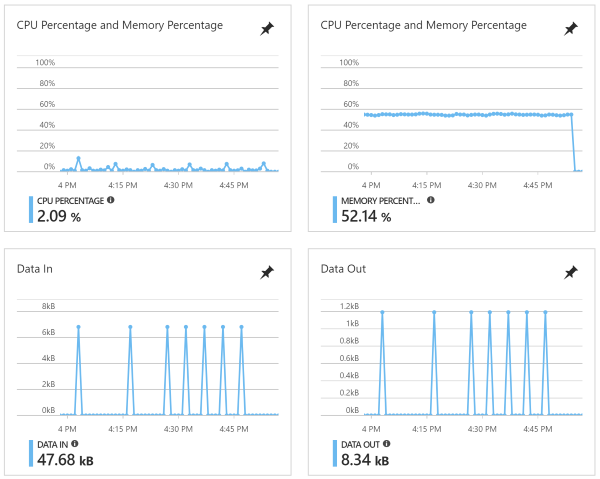
The default telemetry on an App Service Plan level are pretty basic. You can see CPU and Memory usage of the hosted web server, with data in and out.
I do check this ever so often, but not on a daily basis. If you have more than one app service on the same plan, then you can check to see if there is an application that is hogging resources. To do so, navigate to: App Service Plan –> Diagnose and solve problems –>
Tools - Metrics per instance. Note this menu item keeps moving around. I think this is the third location I’ve seen this item appear. Search around if you cannot find it.
App Service
On the App Service level itself, you get most of the same information as on a Plan level, but only for the application you are viewing. Additionally, you have information available like: number of requests, erroneous requests (can be filtered per status code (4xx and 5xx)) and CPU utilization of this app service. See the information about the metrics from Application Insights for more (and better in my opinion) informational data.
Database
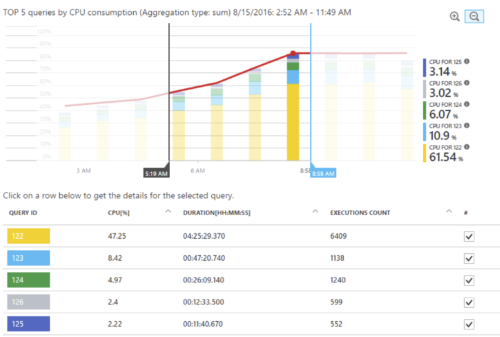
One example of the additional telemetry data that I got from Application Insights was for the Azure SqL Database that was used. Thanks to Application Insights, you’ll get the following (very handy!) information:
- Query duration
- Number of times a query has been run against the database
- Where that query has been called from (e.g. in your application code)
Some of this information is also visible from the Azure SQL Database itself, but I think Application Insights provides nicer reporting on it.
This came in very handy when searching for performance issues throughout the application. I made this information available in a separate dashboard to be used for hunting down those issues, because I didn’t need them for the operational overview that I made sure to have always visible on a separate screen.
Note: some of this information is also available from Query Insights.
Database Transaction Units (DTU)
Next up is the standard database telemetry that Azure already logged for us: the most interesting parts are database size, maximum database size and even more important: DTU measurements! For a more in dept explanation about DTU’s, check Microsoft’s explanation here.
Picking a good service tier for your database can be tricky and depends heavily on you usage patterns. If you have spikey traffic (think long running transactions or daily ETL tasks), you can consider changing the database tier up front or over provisioning (can be costly). Of course, you can think of other tactics to prevent running into the Max DTU for your service level, like caching (always tricky!), offloading heavy writes & updates to a different storage mechanism (or sticking it in a queue!).
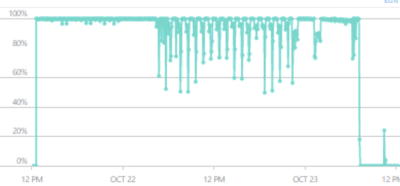
Anyway: make sure to test with a representative load before running it in production! Seeing a chart link above is not great in production.
Changing the service tier is possible, but you really do not want to do this during a long running transaction. This will only make your performance issue last longer :-).
Blob Storage
On blob storage you’ll want to start with monitoring these metrics: Ingress (traffic into the storage account, so uploads), Egress (traffic out of the storage account, so downloads). Next up will be the latency and number of requests.
Depending on the layout of your storage account, you might want to dig deeper in the used ‘folders’ or ‘containers’ inside of the storage account. I had once a multitenant SaaS application that billed the tenants for (parts of) the used storage, so I talked to the storage API to get file and size measurements per tenant. To start retrieving that information, you can look here.
Next up:
The next post in this series will be: ‘Part 3 - Supporting of the support systems’. I think it could be helpful to have a (start of) a list of items I started tracking that come up when checking the support systems like blob storage and SSL certificates. Sometimes these parts of the system are forgotten, until it is to late! I’ll dive into that in the next post.
I’ll update this post with a link when Part 3 is available.